
Most marketplace sellers are drowning in dashboard data while misreading the numbers that actually matter. ACoS looks good. TACoS is rising. Conversion rate is dropping. Buy Box is slipping. Here are the 5 metrics that reveal what is really happening in your business in 2026.
- Only 23 percent of sellers track more than 5 KPIs regularly, yet multi-metric sellers report 34 percent higher profit margins, making data discipline the single highest-leverage non-advertising activity
- TACoS (Total Advertising Cost of Sales) is the true profitability gauge, a rising TACoS signals organic rank decay being masked by paid traffic, the most expensive and invisible form of business deterioration
- Conversion rate at the keyword level, not just overall, is how the algorithm decides organic rank; a listing with strong overall CVR but weak keyword-level CVR will stall despite good ad spend
- Over 82 percent of marketplace sales go through the Buy Box, meaning Buy Box percentage loss is a silent revenue killer that is routinely misdiagnosed as a traffic or campaign problem
- Organic rank movement is the leading indicator of whether advertising is building a business or simply renting visibility; sellers who never track it discover the treadmill effect too late to recover efficiently
Introduction
Data has become the backbone of marketplace selling, but here is the uncomfortable truth: most sellers are drowning in numbers without knowing which ones actually matter. Dashboards are full of ACoS, CTR, impressions, and session data, and sellers often mistake movement in one area for genuine progress while their bottom line tells a completely different story.
In 2026, the challenge is not a lack of analytics. Platforms now provide more metrics than ever, from Brand Analytics and Search Query Performance to detailed PPC dashboards and contribution margin reports. The problem is interpretation. Sellers chase vanity metrics while ignoring the deeper KPIs that actually reveal profitability and long-term health. And the consequences compound quietly: campaigns that look healthy on paper, businesses that appear to be growing, and profits that are silently disappearing.
Consider the most common traps. If ACoS looks good but TACoS is rising, are you actually scaling profitably? If CTR is strong but conversion rate is low, are your ads working or just generating expensive traffic? If impressions are climbing but Buy Box share is eroding, who is actually capturing the sales your ads are paying to generate?
Research across hundreds of seller accounts shows that only 23 percent of marketplace sellers track more than five KPIs regularly, yet multi-metric sellers report 34 percent higher profit margins on average. The numbers are stark: data discipline is not optional at the level this market demands in 2026.
This article breaks down why most sellers are looking at the wrong numbers, which five metrics actually determine business health in 2026, and how to build a data framework that translates dashboards into decisions.
The Vanity Metric Trap: Why Sellers Misread Their Data
Most sellers begin their analytics journey by looking at surface-level numbers: ACoS, CTR, impressions, and total revenue. These metrics are not useless. They serve as directional indicators. But they do not tell the full story, and when sellers treat them as the primary measure of success, they build strategies on misleading foundations.
The most pervasive mistake is treating ACoS as the definitive profitability signal. A low ACoS looks impressive in a campaign report. But ACoS only measures ad spend relative to ad-attributed sales. It says nothing about what is happening to your total organic sales, your total revenue, or your overall ad dependency. A seller can have a perfectly optimized 15 percent ACoS while TACoS is climbing to 25 percent, indicating that organic sales are quietly collapsing and paid traffic is filling the gap. The business looks efficient on one metric while bleeding on the most important one.
High impressions create a similar illusion. Seeing impression counts climb feels like progress. But impressions without conversions are the most expensive form of visibility available. They indicate that your ads are being served, not that buyers are responding. Sellers who report growth because their ad exposure is increasing while conversion rate and organic rank decline are misreading their dashboard completely.
CTR suffers from the same problem. A strong click-through rate confirms your ad creative is compelling enough to earn a click. But if that click does not convert, you have paid for engagement that generated nothing. CTR without conversion rate context is the equivalent of a store that attracts foot traffic but closes no sales.
Short-term spikes compound these misreadings further. Sellers see a positive week in sessions or orders and interpret a campaign as working. But one week of data is noise. Seasonal swings, competitor stockouts, price promotions, or algorithm fluctuations can all produce temporary improvements that have nothing to do with campaign quality. Without a longer time horizon and the right comparison baseline (same weekday versus the same weekday last week, not adjacent days), daily fluctuations create false signals that lead to reactive decisions that destabilize campaigns.
Data overload is the final trap. With dozens of available metrics, sellers gravitate toward the ones that confirm their preferred narrative rather than the ones that challenge it. The solution is not analyzing more. It is analyzing the right things with discipline.
Metric 1: TACoS (Total Advertising Cost of Sales)
TACoS is the single most important advertising metric available to marketplace sellers, and it is the one most frequently ignored.
ACoS measures your ad spend as a percentage of your ad-attributed sales only. TACoS measures your ad spend as a percentage of your total revenue, including both paid and organic sales. This distinction is everything. A business can post an excellent ACoS while TACoS is rising, which means organic rank is decaying and paid advertising is compensating for lost organic volume. The ads look efficient. The business is actually getting weaker.
The formula is straightforward: TACoS = Total Ad Spend divided by Total Revenue, multiplied by 100.
If you spend two thousand dollars on ads and generate twenty thousand dollars in total sales, your TACoS is 10 percent. If your ACoS is 20 percent but most of your revenue is organic, that ACoS is not a problem. If your ACoS is 15 percent but nearly all of your revenue is ad-attributed, your business is renting visibility rather than building it.
The patterns worth watching:
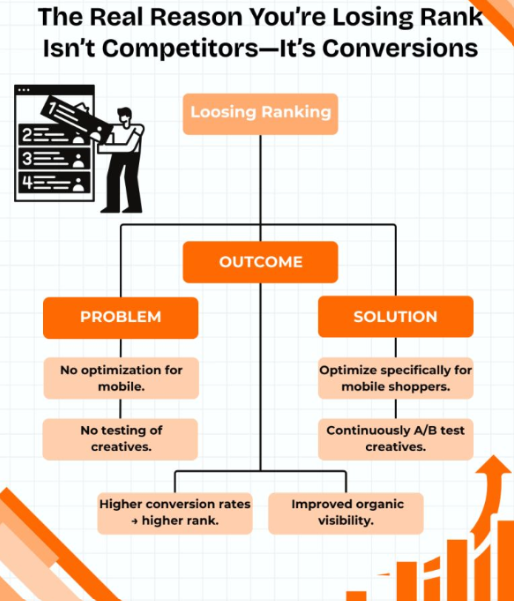
A falling TACoS with stable or growing revenue is the signal every seller wants. It means your advertising is building organic momentum. As ads drive conversions on target keywords, the algorithm rewards those keywords with stronger organic placement, which generates more organic sales, which reduces your total ad dependency over time. This is the PPC-to-organic flywheel working as intended.
A rising TACoS with flat or declining revenue is the warning sign that should trigger an immediate strategic review. It means your organic rank is slipping and you are increasing ad spend just to maintain the same total sales volume. You are running faster to stay in the same place, and eventually the margin math stops working.
A stagnant TACoS with growing revenue is the healthiest outcome during a launch or growth phase. Your ad dependency as a percentage is holding steady while the absolute business is scaling.
Benchmarks for 2026: Established products in mature catalogs should target 5 to 12 percent TACoS. Products in an active launch phase (first 60 to 90 days) typically run 15 to 25 percent as organic velocity builds. TACoS above 25 percent on a product live for six or more months almost always indicates organic rank decay with paid traffic masking the problem.
Track TACoS monthly at a minimum. Sellers who only watch ACoS daily and never look at TACoS often discover the decay too late, when reversing it requires significant budget and time.
Metric 2: Conversion Rate (CVR)
Conversion rate is the percentage of shoppers who visit your product page and complete a purchase. It is one of the most important and most consistently underweighted metrics in marketplace analytics.
The platform's average conversion rate is 10 to 15 percent for established products, which is roughly seven to ten times higher than typical e-commerce websites. This high baseline is driven by the shopping platform's purchase-intent environment. But the gap between a well-optimized listing and a neglected one is enormous. Electronics categories average 3 to 8 percent conversion. Consumables and grocery categories can reach 15 to 25 percent. The correct benchmark is your specific category, not a platform-wide average.
Why conversion rate matters beyond the obvious: the algorithm weights keyword-level conversion heavily in ranking decisions. A listing with a strong overall CVR but weak conversion on its primary target keywords can still stall organically. This means tracking overall CVR is important, but tracking CVR by keyword gives you the diagnostic depth to understand which terms are actually earning rank versus which are spending budget without contributing to algorithmic growth.
CVR also functions as your earliest diagnostic signal. If conversion rate drops and nothing obvious has changed (no price increase, no significant new negative reviews), the cause is almost always found in one of four places: a listing element has degraded (image, copy, or title), a competitor has improved their positioning, a new negative review has emerged that is influencing buyer confidence, or the traffic source has shifted to lower-intent queries. Each of these is fixable, but none of them is visible if you are not watching CVR closely.
The compounding benefit of improving CVR: higher conversion rates lower your effective CPC. The algorithm rewards high-converting ads with better placement and greater cost efficiency. A seller who improves CVR from 8 percent to 12 percent on the same traffic is not just increasing revenue. They are reducing the effective cost of every click they buy and improving their organic rank simultaneously.
Below 8 percent CVR for an established product, the fix almost always begins with the main image, price positioning, or review count, in that order. Spending more on ads to drive traffic to a listing that cannot convert compounds the loss rather than solving it.
Metric 3: Buy Box Percentage
The Buy Box (now called the Featured Offer on some platforms) is the default purchase mechanism that the vast majority of buyers use. Research consistently shows that over 82 percent of marketplace sales go through the Buy Box. That means if you are losing Buy Box share, more than four out of five potential purchases from your listing are at risk.
Many sellers overlook this metric because they assume that if their product is live and their ads are running, they control the sales. This assumption is one of the most expensive mistakes a seller can make.
A seller might interpret a sudden drop in sales as a traffic problem and respond by increasing ad spend. If the real cause is Buy Box loss due to a pricing trigger, a seller metrics decline, or an inventory stockout, more ad spend accelerates the loss rather than solving it. Running ads without controlling the Buy Box is exactly as effective as advertising a store to buyers and then having them discover another seller's version of the product at the register.
The mechanics of Buy Box eligibility in 2026 depend on a combination of factors: competitive pricing relative to other offers, seller performance metrics (Order Defect Rate, Late Shipment Rate, Valid Tracking Rate), inventory availability, and fulfillment method. FBA sellers have a structural advantage in most of these factors, but they are not immune to loss, particularly when pricing slips outside the competitive range or when inventory caps prevent timely restocking.
The practical implication for campaigns: when a seller loses the Buy Box, Sponsored Product ads stop running for that product. The campaign appears to still be active in the dashboard but is not serving. Sellers who do not monitor Buy Box percentage alongside campaign performance frequently misattribute the drop in impressions and clicks to campaign issues rather than the actual cause. The diagnosis is wrong, the fix is wrong, and the loss continues.
Check Buy Box percentage in your business reports at least weekly. Set an alert threshold. A drop below 80 percent on a mature product warrants immediate investigation. A drop below 50 percent is a crisis that should trigger the same urgency as a listing suppression.
Metric 4: Repeat Purchase Rate
Customer acquisition on a marketplace is expensive. Advertising costs rose 22 percent year over year in 2025 alone. In this environment, treating every buyer as a single-transaction relationship and measuring success only by new customer acquisition creates a fragile business that requires relentless spending just to maintain revenue.
Repeat purchase rate measures the percentage of orders placed by customers who have bought from you before. Sellers who ignore this metric often misread their growth story entirely, believing they are scaling when they are actually churning customers at the same rate they acquire them. Revenue grows on paper because they are acquiring new buyers constantly, but the cost to generate that revenue grows equally fast, and margins remain flat or worsen.
A strong repeat purchase rate fundamentally changes the economics of your business. When an existing customer returns, your customer acquisition cost for that purchase is near zero. You spend nothing on the click that brought them back. Your margin on that sale is structurally higher. Your TACOS on repeat sales is dramatically lower than on first-time purchases. Over time, a business with strong repeat purchase rate can sustainably reduce ad dependency as a portion of revenue, because the returning buyer segment requires no advertising to convert.
In 2026, Subscribe and Save programs, Brand Store analytics, and Sponsored Display retargeting data all provide better insight into customer loyalty than was available even two years ago. Sellers who actively build loyalty through follow-up experience, product quality, and strategic retargeting campaigns are not just protecting current revenue. They are building a compounding advantage that becomes more durable with every passing quarter.
The sellers who struggle most with repeat purchase rate are those in highly commoditized categories where brand differentiation is low. If a buyer has no reason to specifically return to your brand versus any comparable alternative, they will not. This makes repeat purchase rate one of the clearest signals of whether your brand is actually building equity or simply participating in a volume game with thin margins.
Practical starting point: segment your orders by new versus returning customers in your brand analytics. If your repeat purchase rate is below 15 percent in a consumable or replenishable category, that is a signal worth investigating. If it is above 30 percent, you have a loyalty foundation worth doubling down on through retargeting, Subscribe and Save incentives, and brand story investment.
Metric 5: Organic Rank Movement
Organic rank is the ultimate long-term health metric for a marketplace business. Every other lever, ads, listing optimization, pricing strategy, all of them exist in service of one goal: to earn and hold strong organic placement on your highest-value keywords. Sellers who do not track organic rank movement are flying blind on the most important outcome in their business.
The relationship between advertising and organic rank is not linear, and this is where many sellers misread their data most severely. Ads drive clicks and conversions. Conversions on specific keywords signal relevance to the algorithm. The algorithm rewards that relevance with improved organic placement. Improved organic placement generates organic traffic at zero additional cost. That organic traffic converts, which generates more signal, which improves rank further. This is the flywheel. But if you never track organic rank, you cannot see whether the flywheel is spinning or stalling.
Sellers who run strong ad campaigns but never check organic rank often discover too late that their rank has been stagnant or declining for weeks. They have been generating conversions that are not translating into rank improvement, which usually indicates a listing relevance problem: the keywords in their campaigns do not match the keywords in their listing copy and backend terms closely enough for the algorithm to confidently promote the product organically for those queries.
Organic rank movement also protects against the treadmill effect: the pattern where a seller continuously increases ad spend to maintain sales volume without realizing that organic rank has flatlined. Total revenue looks stable. Ad spend creeps upward. TACoS rises. The business looks fine from the outside and is quietly becoming more fragile with every passing week.
The practical monitoring approach: track organic rank weekly for your five to ten highest-value keywords. Use rank tracking tools or Search Query Performance data. Define a threshold that triggers investigation: if rank drops more than three positions on a primary keyword over a two-week period with no obvious cause, investigate immediately. Check for listing suppression, a recent negative review cluster, a competitor listing improvement, or keyword indexing loss in backend terms.
A rising organic rank trajectory, even one position per week on a competitive keyword, is one of the most valuable leading indicators of business health available. It means your listing is earning algorithmic trust, your advertising is functioning as a growth investment rather than a maintenance cost, and your long-term cost structure is moving in the right direction.
Why Most Sellers Still Get This Wrong
The tools to track all five of these metrics have been available for years. The data is accessible in Seller Central, Brand Analytics, and a wide range of third-party platforms. Yet research shows that the majority of sellers still prioritize surface-level metrics over the five that actually predict business health. Why?
Comfort metrics are easier to interpret. ACoS produces a single clean number that looks actionable. TACoS requires cross-referencing ad spend against total revenue across paid and organic channels. Conversion rate requires understanding category benchmarks. Buy Box percentage requires correlating with suppression events and fulfillment status. Repeat purchase rate requires segmented customer data. Organic rank requires ongoing keyword tracking infrastructure. Each of these requires more discipline than checking an ACoS dashboard once a day.
Short time horizons create reactive patterns. Sellers who check data daily are exposed to noise. The right cadence for most of these metrics is weekly, with monthly pattern analysis. But sellers under revenue pressure feel compelled to act on daily fluctuations, which produces a constant stream of small decisions that destabilize what should be steady campaign structures.
Siloed analysis prevents systems thinking. Many sellers analyze PPC, organic rank, and conversion rate as separate disciplines managed by separate team members or reviewed in separate reports. The insight that emerges from connecting these three, understanding how a conversion rate drop is suppressing rank, which is increasing TACoS, which is indicating structural listing problems, only appears when the metrics are viewed together.
The sellers who master these five metrics stop reacting to data and start reading it. They build a coherent picture of business health that lets them make confident strategic decisions rather than chasing daily numbers. In 2026, that discipline is not a competitive advantage. It is the entry requirement for sustainable growth.
Conclusion
The marketplace is a data-driven environment, but not all data drives good decisions. Sellers who build strategies around ACoS, CTR, and impressions will continue running campaigns that look healthy on paper while profitability quietly decays. The numbers feel actionable. The business outcome is not.
TACoS, Conversion Rate, Buy Box Percentage, Repeat Purchase Rate, and Organic Rank Movement are the five metrics that actually reveal whether a marketplace business is growing or slowly bleeding. Each one captures a dimension of performance that surface metrics cannot see, and together they create a complete picture of business health.
Shifting focus to these five requires discipline and a longer time horizon than most sellers are accustomed to. It means being willing to look past the feel-good numbers and examine the ones that tell the harder truth. But the sellers who make this shift gain something more valuable than a cleaner dashboard: they gain the ability to see problems before they compound and opportunities before competitors notice them.
The 90 percent of sellers who misread their data will keep doing so. The 10 percent who master these metrics will capture disproportionate growth in 2026 and build businesses that do not just perform in one quarter but compound across years.
Ready to stop chasing vanity metrics and start scaling with the numbers that actually matter?
At Brevlin, we help sellers cut through the noise, identify the KPIs that reflect true business health, and build data-driven decision frameworks that translate dashboards into revenue.
Work with Brevlin to make your data drive profit, not confusion.
A deep-dive into the five marketplace analytics metrics that actually determine business health in 2026, TACoS, Conversion Rate, Buy Box Percentage, Repeat Purchase Rate, and Organic Rank Movement. Covers why sellers misread surface-level data, what each metric reveals that vanity metrics cannot, benchmarks from 2026 research, and how to build a monitoring framework that drives decisions. Includes 5 FAQs and a CTA to Brevlin's analytics services.
Dashboards reward watching, not deciding. The sellers who grow pick five numbers, check them weekly, and act. TACoS creeping up quietly is the one I would never ignore. — Maimoona Iqbal (Marketplace Growth Specialist)
Artikel fertig. Du hast gerade 17 Minuten in dein Wissen investiert.
Häufig gestellte Fragen
ACoS measures your ad spend as a percentage of ad-attributed sales only. TACoS measures ad spend as a percentage of all sales including organic. ACoS tells you how efficient your campaigns are. TACoS tells you how dependent your entire business is on paid traffic. A falling TACoS while revenue grows is the signal that advertising is building organic momentum. A rising TACoS with flat revenue means organic rank is slipping and ads are compensating. Always prioritize TACoS for strategic decisions.
For established products in a mature catalog, 5 to 12 percent TACoS is strong. For products in an active launch phase (first 60 to 90 days), 15 to 25 percent is typical and acceptable as organic velocity builds. TACoS above 25 percent on a product that has been live for six or more months almost always indicates organic rank decay with paid traffic masking the problem.
Buy Box percentage and conversion rate warrant daily monitoring because drops can indicate urgent operational issues (suppression, stockout, listing problem). TACoS and organic rank movement are best reviewed weekly with monthly pattern analysis. Repeat purchase rate is most meaningful reviewed monthly or quarterly to identify loyalty trends. Always compare same-day versus same-day last week, not adjacent days, to control for daily shopping pattern variance.
When a seller loses the Buy Box, Sponsored Product ads stop serving for that product. The campaign remains active in the dashboard but generates no impressions or clicks. Sellers who don't monitor Buy Box percentage alongside campaign performance frequently misattribute the drop in ad performance to campaign issues rather than the actual cause, leading to incorrect diagnosis and wasted optimization effort.
Use third-party rank tracking tools or Search Query Performance data in Brand Analytics to monitor your top five to ten highest-value keywords weekly. Define an investigation threshold: if rank drops more than three positions on a primary keyword over a two-week period without obvious cause, investigate immediately for listing suppression, keyword indexing loss, or a competitor listing improvement. Consistent weekly tracking is what separates proactive management from discovering rank decay weeks after it began.


